|
|
|
|
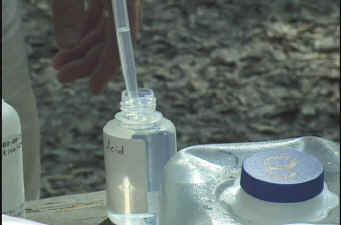
Manatee Springs Water Quality Testing 8/12/2001 Submitted by National Speleological Society Cave Diving Section divers. Water samples were taken at nine locations. See the map below for location details. Conductivity and pH were obtained using a HydroLab data sonde. One sample bottle each was labeled for turbidity and nutrient testing. The nutrient testing bottles were preserved with H2SO4.
Temperature was obtained with mercury thermometers. At location nine, we were only able to get one sample bottle. We preserved this for nutrient testing since the silty conditions and resulting particulate in the sample invalidated any turbidity information. This particular location is one of several small (3-4 inch diameter) vents in the floor that discharge noticeably warmer water. Participants: Cindy Butler, Al Heck, Brett Hemphill, Ken Hill, Robin Hill, James Hurley, Annette Long, Mark Long, Beth Murphy, Jerry Murphy, Michael Poucher, Sandra Poucher, Beth Somers.Samples : (See map below for more detailed location information)
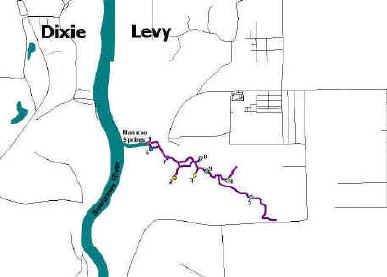
The map below shows the location of water samples taken on 8/12/2001. The numbers correspond to ID numbers on the sample data in the table above.
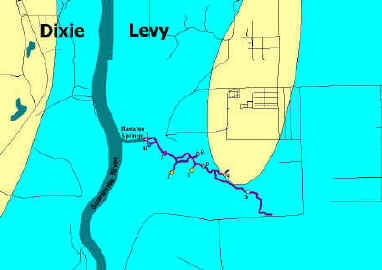
The map below shows the cave with soils types superimposed. Yellow indicates sandy soils while blue is primarily limestone.
|
||||||||||||||||||||||||||||||||||||||||||||||||||||||||||||||||||||||||||||||||||||||||||||||||||||||||||||||||||||||||||||||||||||||||||||||||
![]()
Copyright © 2001-2025